


How to Use Fiverr Analytics to Double Your Sales [2026 Step-by-Step Guide]
Here’s a number that might shock you: over 80% of Fiverr sellers never look at their analytics dashboard. They set up a gig, write a description, and then just… wait. Meanwhile, the top 5% of sellers — the ones pulling in $3,000, $5,000, even $10,000+ per month — are obsessing over their data every single week.
The difference between a struggling Fiverr seller and a thriving one often isn’t talent. It’s not even experience. It’s whether you understand Fiverr analytics and use that data to make smarter decisions about your gigs, your pricing, and your marketing.
I know because I’ve been on both sides. I spent my first six months on Fiverr making about $150 a month, wondering what I was doing wrong. Then I started actually paying attention to my numbers — and within 90 days, I’d crossed $1,200 a month. Same skills. Same niche. Completely different approach.
In this guide, I’m going to walk you through exactly how to read, interpret, and act on your Fiverr analytics to dramatically increase your sales. Whether you’re brand new to the platform or you’ve been grinding for a while without the results you want, this is the roadmap you’ve been looking for. Let’s dig in.
What Are Fiverr Analytics and Why Should You Care?
Before we get into the tactical stuff, let’s make sure we’re on the same page about what Fiverr analytics actually means.
Fiverr provides every seller with a built-in analytics dashboard. You’ll find it by going to your seller dashboard and clicking on “Analytics” in the left-hand menu. It’s free. It’s available to every seller level. And honestly? It’s one of the most underrated tools on the entire platform.
Your Fiverr analytics dashboard tracks several critical data points:
- Impressions — How many times your gig appeared in search results or category pages
- Clicks — How many people actually clicked on your gig to learn more
- Orders — How many of those clicks turned into paying customers
- Revenue — Your total earnings over a given time period
- Conversion Rate — The percentage of visitors who placed an order
- Click-Through Rate (CTR) — The percentage of impressions that turned into clicks
- Cancellation Rate — How often orders get cancelled (this one matters more than you think)
Think of it like running a small shop. Impressions are the people walking past your storefront. Clicks are the people who walk in. Orders are the ones who actually buy something. If you don’t know which part of your “shop” is underperforming, you’re just guessing.
And guessing, my friend, is not a business strategy.
If you haven’t set up your seller profile yet, you can create your free Fiverr account and start exploring the analytics dashboard right away — even before you publish your first gig.
Understanding the Fiverr Analytics Dashboard: A Complete Breakdown
Now let’s get into the meat of things. I’m going to break down each metric in your Fiverr analytics dashboard, explain what it really tells you, and show you what “good” numbers look like.
1. Impressions: Your Visibility Score
Impressions tell you how often your gig is showing up in front of potential buyers. This is your top-of-funnel metric — if this number is low, nothing else matters because nobody’s even seeing your work.
What’s a good number? That depends heavily on your niche. A logo design gig might get 5,000+ impressions per month because it’s a high-volume category. A niche service like “Solidity smart contract auditing” might only get 200-500 impressions — but those impressions are way more targeted.
Benchmarks to aim for:
- New sellers (first 30 days): 500–2,000 impressions/month
- Established sellers (Level 1-2): 2,000–10,000 impressions/month
- Top Rated Sellers: 10,000–50,000+ impressions/month
If your impressions are low, the problem is usually one of these: poor keyword optimization in your gig title and tags, a saturated category where you’re getting buried, or you simply haven’t been on the platform long enough to build authority.
2. Clicks: Your First Impression Metric
Clicks tell you how many people saw your gig in search results and thought, “That looks interesting, let me check it out.” The ratio of clicks to impressions gives you your Click-Through Rate (CTR).
A healthy CTR on Fiverr typically falls between 3% and 8%. If you’re below 3%, your gig thumbnail, title, or starting price isn’t compelling enough. If you’re above 8%, you’re doing something very right — keep it up.
What influences clicks?
- Your gig thumbnail (this is HUGE — probably 60% of the equation)
- Your gig title (clear, benefit-driven, keyword-rich)
- Your starting price
- Your seller rating and review count
- Your seller level badge
3. Orders and Conversion Rate: The Money Metric
This is where the rubber meets the road. Your conversion rate tells you what percentage of people who visit your gig page actually place an order. On Fiverr, a conversion rate between 2% and 5% is considered solid. Top performers hit 8-10%+.
Let me put this in real numbers so you can see why small improvements matter:
| Scenario | Monthly Impressions | CTR | Clicks | Conversion Rate | Orders | Avg. Order Value | Monthly Revenue |
|---|---|---|---|---|---|---|---|
| Before Optimization | 5,000 | 3% | 150 | 2% | 3 | $50 | $150 |
| After Optimization | 5,000 | 6% | 300 | 4% | 12 | $50 | $600 |
| After Optimization + Upsell | 5,000 | 6% | 300 | 4% | 12 | $85 | $1,020 |
Same number of impressions. Almost 7x the revenue. That’s the power of understanding and optimizing your Fiverr analytics. You don’t need more traffic — you need to convert the traffic you already have.
🔑 Key Takeaway: Doubling your CTR and doubling your conversion rate creates a 4x multiplier on your sales — even if your total impressions stay exactly the same. This is why Fiverr analytics matters so much.
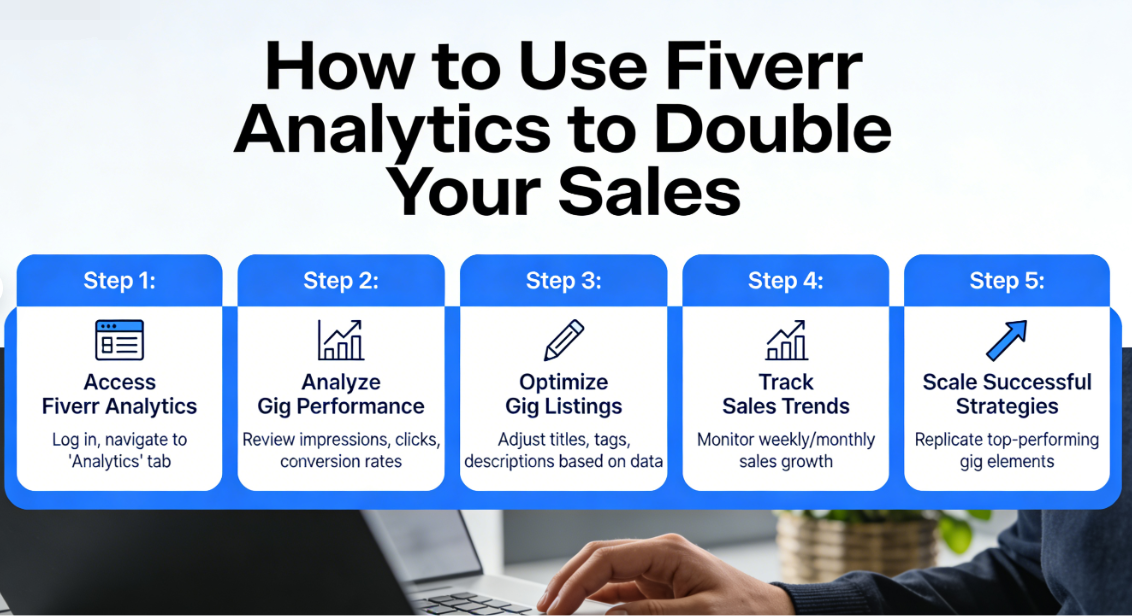
Step-by-Step: How to Use Fiverr Analytics to Double Your Sales
Alright, theory is great. But you’re here for the practical, roll-up-your-sleeves stuff. So let’s walk through the exact process I use every week to analyze my data and make improvements. For more foundational strategies, check out our complete Fiverr guide.
Step 1: Set Your Baseline (Week 1)
You can’t improve what you don’t measure. Before you change anything, log into your analytics dashboard and record these numbers for the past 30 days:
- Total impressions per gig
- Total clicks per gig
- CTR per gig (clicks ÷ impressions × 100)
- Total orders per gig
- Conversion rate per gig (orders ÷ clicks × 100)
- Average order value
- Total revenue
Write these down in a spreadsheet. Seriously — I know it sounds tedious, but this spreadsheet is going to become your secret weapon. I use a simple Google Sheet with one row per gig and one column per metric. Update it every Sunday morning with your coffee.
Pro tip: If you have multiple gigs, rank them by revenue. Your top-performing gig is where you should focus optimization efforts first — a 10% improvement on a gig earning $500/month beats a 50% improvement on one earning $20/month.
Step 2: Diagnose Your Funnel Leaks (Week 1-2)
Now comes the detective work. Look at your data and figure out where people are dropping off. Here’s how to diagnose the problem:
Low Impressions (under 1,000/month)?
- Your gig probably isn’t ranking in Fiverr’s search
- Fix: Optimize your gig title, tags, and description with relevant keywords
- Fix: Make sure you’re using all 5 search tags
- Fix: Consider adding more gigs targeting different keyword variations
Decent Impressions but Low CTR (under 3%)?
- People see your gig but aren’t clicking
- Fix: Redesign your gig thumbnail (bright colors, clear text, professional look)
- Fix: Rewrite your gig title to be more benefit-focused
- Fix: Consider adjusting your starting price
Good Clicks but Low Conversion Rate (under 2%)?
- People are interested but your gig page isn’t closing the deal
- Fix: Improve your gig description with social proof and clear deliverables
- Fix: Add a gig video (sellers with videos convert 40% better)
- Fix: Upgrade your portfolio images
- Fix: Review your pricing packages — make sure Package 2 is the obvious “best value”
💡 Pro Tip: I call this the “funnel diagnosis” method. It takes the guesswork out of optimization completely. Instead of randomly tweaking things and hoping for the best, you’re making data-driven decisions. This is how serious freelancers approach their freelance income growth.
Step 3: Optimize Your Gig Thumbnails (Week 2)
If your diagnosis revealed a CTR problem, start here. Your gig thumbnail is the single most important visual element in your entire Fiverr presence. It’s the first thing buyers see, and you have about 1.5 seconds to grab their attention.
Here’s what works in 2026:
- Use bold, contrasting colors — avoid white backgrounds that blend in with Fiverr’s interface
- Include a clear text overlay — state your main deliverable in 3-5 words
- Show a sample of your work — before/after comparisons work incredibly well
- Use your face — thumbnails with human faces get 15-20% higher CTR on average
- Keep it clean and uncluttered — one focal point, not a collage of 12 things
I recommend creating 2-3 thumbnail variations and testing them. Change your thumbnail, wait 7-10 days, check your CTR in Fiverr analytics, and compare it to your baseline. Keep the winner and try to beat it.
Step 4: Rewrite Your Gig Description for Conversions (Week 2-3)
If clicks are fine but conversions are low, your gig description needs work. Most sellers make the mistake of writing about themselves: “I am a professional designer with 10 years of experience…” Buyers don’t care about you. They care about their problem and whether you can solve it.
Here’s the gig description formula that’s worked best for me:
- Hook (1-2 lines): Call out their pain point. “Struggling to get your website noticed? Your logo might be the problem.”
- Solution (2-3 lines): Explain what you’ll do for them. Focus on outcomes, not processes.
- Social Proof (1-2 lines): “I’ve designed 500+ logos for businesses in 30 countries” or “⭐ 4.9 rating from 200+ happy clients.”
- What’s Included (bullet list): Break down your deliverables clearly.
- CTA (1 line): “Order now or message me with your project details!”
This structure works because it follows the AIDA framework (Attention, Interest, Desire, Action) — the same copywriting formula that’s been selling products for over a century. For more Fiverr tips on crafting the perfect gig page, explore our freelancing resources.
🚀 Ready to Put These Strategies into Action?
If you don’t have a Fiverr account yet, you’re leaving money on the table. The platform has over 4.2 million active buyers searching for services right now — and the analytics tools to help you reach them are completely free.
Sign up for Fiverr here and start setting up your first gig today. It takes less than 10 minutes to get started, and you can begin tracking your analytics from day one.
Step 5: Optimize Your Pricing Packages (Week 3)
Your pricing structure has a massive impact on both your conversion rate and your average order value. Fiverr lets you create three packages — Basic, Standard, and Premium — and most sellers don’t use this feature strategically.
Here’s the psychology hack: use the “decoy effect.”
Make your Standard package the obvious best value. Your Basic should feel limited (so people upgrade), and your Premium should feel aspirational. Most buyers will naturally gravitate toward the middle option — so make that one your profit sweet spot.
Example for a logo design gig:
| Feature | Basic ($25) | Standard ($65) | Premium ($120) |
|---|---|---|---|
| Logo Concepts | 1 | 3 | 5 |
| Revisions | 1 | Unlimited | Unlimited |
| Source File | ❌ | ✅ | ✅ |
| Social Media Kit | ❌ | ❌ | ✅ |
| Brand Guide | ❌ | ❌ | ✅ |
| Delivery Time | 5 days | 3 days | 2 days |
See how the Standard package includes the source file (which almost every buyer wants) and unlimited revisions? That makes the jump from $25 to $65 feel totally worth it. This simple restructuring alone can increase your average order value by 40-60%.
Step 6: Add a Gig Video (Week 3-4)
According to Fiverr’s own data, gigs with videos are 220% more likely to get ordered than gigs without them. If you’re not using video, you’re competing with one hand tied behind your back.
Your gig video doesn’t need to be a Hollywood production. Here’s what works:
- Length: 30-75 seconds (shorter is better)
- Format: Talking head + screen recordings of your work
- Content: Introduce yourself, show your best work, explain what buyers get, end with a CTA
- Quality: Good lighting, clear audio, and a genuine smile go a long way
Even a simple video recorded on your phone with natural lighting can dramatically improve your conversion rate. I added my first gig video using nothing but my iPhone and a $15 ring light — and saw my conversions jump from 2.8% to 4.6% within two weeks.
Step 7: Track, Test, and Iterate (Ongoing)
This is where most people fall off — and where the magic really happens. Optimization isn’t a one-time event. It’s a continuous cycle of measuring, tweaking, and measuring again.
Here’s my weekly analytics routine (takes about 15 minutes every Sunday):
- Log into the Fiverr analytics dashboard
- Update my tracking spreadsheet with the latest numbers
- Compare this week’s CTR and conversion rate to last week’s
- Identify which gig needs the most attention
- Make ONE change to that gig (not five changes — one)
- Note what I changed and when
- Review results the following week
Why only one change at a time? Because if you change your thumbnail, title, description, and pricing all at once, you’ll have no idea which change made the difference. Isolating variables is the key to data-driven optimization.
🔑 Key Takeaway: The sellers who consistently double their sales aren’t the most talented — they’re the most disciplined about tracking their Fiverr analytics and making incremental improvements every single week. A 5% improvement each week compounds to a 1,164% improvement over a year.
Advanced Fiverr Analytics Strategies for 2026
Okay, so you’ve got the fundamentals down. Let’s level up with some advanced strategies that most Fiverr for beginners guides never cover.
Analyze Your Best-Performing Days and Times
If you look at your Fiverr analytics over a 30-day period, you’ll start to notice patterns. Maybe your impressions spike on Mondays and Tuesdays. Maybe you get more orders on weekday evenings (U.S. time zones). Use this information to your advantage.
When you know your high-traffic days, you can:
- Stay online and available during peak hours (Fiverr’s algorithm favors active sellers)
- Respond to messages faster during these windows
- Schedule gig updates or new gig launches during high-traffic periods
- Run Fiverr Promoted Gigs campaigns during your best-converting times
Use the “Repeat Buyer” Metric to Build Recurring Income
One metric that many sellers overlook is their repeat buyer percentage. Getting a new customer on Fiverr costs time and energy. But a returning customer? That’s almost pure profit — no acquisition cost, no trust-building phase, and they usually spend more per order.
Top Fiverr sellers report that 30-40% of their monthly revenue comes from repeat buyers. If your repeat buyer rate is under 15%, you need to focus on the post-delivery experience:
- Deliver early whenever possible
- Include a “bonus” they didn’t expect (a small extra revision, a free social media mockup, etc.)
- Send a friendly follow-up message 2-3 weeks after delivery
- Create gig extras that encourage ongoing work (e.g., “monthly social media package”)
Spy on Your Competition (Ethically)
While Fiverr doesn’t give you analytics on other sellers, you can do manual competitive analysis. Search for your main keywords, study the top 10 results, and ask yourself:
- What do their thumbnails have that mine doesn’t?
- How are they pricing their packages?
- What’s their review count and rating?
- What keywords are they using in their titles?
- Do they have a gig video?
I do this analysis once a month, and it consistently gives me ideas for improvement. You’re not copying — you’re learning from what the market is already rewarding.
Want to see what top sellers in your niche are doing? Browse top Fiverr gigs in your category and take notes.
Common Fiverr Analytics Mistakes That Kill Your Sales
I’ve mentored over 50 freelancers on Fiverr at this point, and I see the same mistakes over and over. Let’s make sure you avoid them.
Mistake #1: Obsessing Over Impressions While Ignoring Conversions
Impressions are a vanity metric if you can’t convert them. I’ve seen sellers with 20,000 monthly impressions making less than sellers with 2,000 impressions — because the second seller had a 6% conversion rate while the first was at 0.5%. Focus on your conversion rate first.
Mistake #2: Changing Everything at Once
I mentioned this earlier, but it bears repeating. When your sales are slow and you’re feeling desperate, there’s a temptation to overhaul your entire gig overnight. Resist that urge. Make one change. Measure the impact. Then move to the next thing.
Mistake #3: Not Checking Analytics Regularly Enough
If you’re only looking at your numbers once a month, you’re missing important trends. Weekly check-ins (even just 10 minutes) keep you connected to your data and help you catch problems before they snowball.
Mistake #4: Ignoring Cancellation Rate
Your cancellation rate is a killer metric that many sellers forget about. A high cancellation rate (above 5%) signals to Fiverr’s algorithm that something is wrong — and it will push your gigs down in search rankings. Monitor this closely and address the root cause immediately if it spikes.
Mistake #5: Not Using All Available Gig Slots
Fiverr allows you to create up to 7 active gigs (more at higher levels). Each gig is an additional entry point to your profile. More Fiverr gigs means more impressions, more data points in your analytics, and more chances to capture different buyer intents. Use every gig slot you have.
For a deep dive into avoiding common pitfalls, check out more Fiverr tips in our resource hub.
Real Results: A Fiverr Analytics Case Study
Let me share a real example to bring all of this together. (Names changed for privacy.)
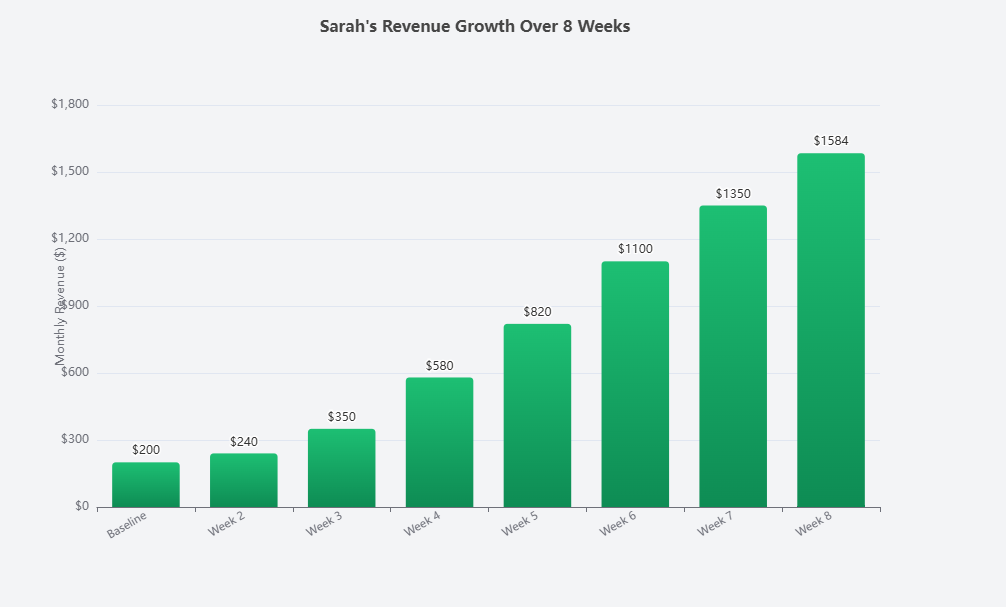
Sarah is a freelance copywriter who’d been on Fiverr for 8 months. She had one gig — “I will write SEO blog posts” — making about $200/month. Not bad, but not enough to replace her day job.
Here’s what her Fiverr analytics looked like when she reached out to me:
- Impressions: 3,200/month
- Clicks: 96 (CTR: 3%)
- Orders: 4 (Conversion: 4.2%)
- Average order: $50
- Revenue: $200/month
Diagnosis: Her conversion rate was actually decent at 4.2%. The main problem was impressions and CTR. She wasn’t getting enough eyeballs, and the ones who saw her gig weren’t clicking.
What we changed (one thing per week):
- Week 1: Redesigned her thumbnail with a bold green background, her photo, and the text “SEO Blog Posts That Rank”
- Week 2: Rewrote her gig title to “I Will Write SEO-Optimized Blog Posts That Drive Organic Traffic”
- Week 3: Added a 45-second gig video introducing herself and showing client results
- Week 4: Created 3 additional gigs targeting related keywords (“website copy,” “product descriptions,” “email sequences”)
- Week 5: Restructured her packages with the decoy pricing method
Results after 60 days:
- Impressions: 8,400/month (+162%)
- Clicks: 504 (CTR: 6%) — doubled
- Orders: 22 (Conversion: 4.4%) — roughly maintained
- Average order: $72 (+44% from package restructuring)
- Revenue: $1,584/month (+692%)
She didn’t learn a single new skill. She didn’t lower her prices. She simply used her Fiverr analytics to identify what was broken and fixed it systematically. That’s the power of data-driven optimization.
Tools and Resources to Supercharge Your Fiverr Analytics
Beyond Fiverr’s built-in dashboard, here are some tools that can help you get even more insights:
- Google Sheets / Excel: For tracking your weekly metrics and spotting trends over time (free)
- Canva: For creating and A/B testing gig thumbnails (free plan available)
- Fiverr Promoted Gigs: Fiverr’s built-in advertising tool that gives you additional performance data and boosts visibility
- Google Trends: To identify seasonal demand for your services and plan gig launches accordingly
- Everbee or similar tools: If you sell on multiple platforms, cross-referencing data can reveal niche opportunities
These tools, combined with your Fiverr analytics data, give you a complete picture of your business performance and growth opportunities.
How to Set Revenue Goals Using Your Analytics Data
One of the most empowering things about understanding your analytics is that it makes goal-setting incredibly concrete. No more vague “I want to make more money” — you can reverse-engineer exactly what needs to happen.
Let’s say your goal is $2,000/month in freelance income. Here’s how to work backward:
- Average order value: $75
- Orders needed: $2,000 ÷ $75 = 27 orders/month
- Conversion rate: 4%
- Clicks needed: 27 ÷ 0.04 = 675 clicks/month
- CTR: 5%
- Impressions needed: 675 ÷ 0.05 = 13,500 impressions/month
Now you have a clear target for each level of your funnel. If your current impressions are at 8,000, you know you need to either increase impressions by ~70% OR improve your CTR and conversion rate to compensate. This kind of clarity is a game-changer.
If you’re just starting your freelance journey and these numbers feel overwhelming, don’t worry. Everyone starts at zero. The important thing is to get started on Fiverr and begin collecting data you can work with.
💰 Start Building Your Freelance Business Today
Every successful Fiverr seller started with their first gig. The analytics strategies in this guide work whether you’re making $0 or $5,000 a month — but they only work if you actually apply them.
Join Fiverr today, set up your first gig, and come back to this guide in 30 days when you have real data to optimize. Your future self will thank you.
Conclusion: Your Fiverr Analytics Action Plan
If you’ve read this far, you now know more about Fiverr analytics than the vast majority of sellers on the platform. That’s a real competitive advantage — but only if you put it into practice.
Let’s recap the key takeaways:
- Track your baseline metrics — You can’t improve what you don’t measure. Start recording impressions, clicks, CTR, conversion rate, and revenue weekly.
- Diagnose before you optimize — Use the funnel diagnosis method to identify exactly where buyers are dropping off (impressions → clicks → orders).
- Make one change at a time — Isolate variables so you know what’s actually working. Test thumbnails, titles, descriptions, videos, and pricing separately.
- Focus on conversion rate AND average order value — These two metrics together have the biggest impact on your bottom line revenue.
- Be consistent — 15 minutes of weekly analytics review will compound into massive results over 3-6 months.
Imagine where you could be 90 days from now. Maybe you’re currently making $200 a month on Fiverr and feeling frustrated. If you follow this system — tracking your data, diagnosing problems, and making systematic improvements — there’s no reason you can’t hit $800, $1,000, or even $2,000 per month. I’ve seen it happen over and over again.
The freelancers who win aren’t the ones with the most talent. They’re the ones who treat their Fiverr gigs like a real business, make data-driven decisions, and show up consistently.
You’ve got the knowledge. Now go apply it. Create your free Fiverr account if you haven’t already, set up your first (or next) gig, and start collecting the data that will transform your freelance income. For even more strategies and guides, don’t forget to explore our complete Fiverr resource hub.
You’ve got this. 🚀
Frequently Asked Questions About Fiverr Analytics
How do I access my Fiverr analytics dashboard?
Log into your Fiverr seller account and click on “Analytics” in the left-hand sidebar of your seller dashboard. You’ll see data on impressions, clicks, orders, and revenue. This feature is available to all sellers regardless of level — you don’t need to be a Level 1 or Top Rated Seller to access it.
What is a good conversion rate on Fiverr?
A conversion rate between 2% and 5% is considered solid for most Fiverr gig categories. Top-performing sellers in less competitive niches can achieve 8-10%+. If your conversion rate is below 2%, focus on improving your gig description, adding a video, upgrading your portfolio samples, and restructuring your pricing packages.
How often should I check my Fiverr analytics?
We recommend checking your Fiverr analytics weekly — a quick 10-15 minute review every Sunday works well. Avoid checking daily, as short-term fluctuations can cause unnecessary anxiety and lead to impulsive changes. Weekly reviews give you enough data to spot meaningful trends while staying connected to your performance.
Can Fiverr analytics help me rank higher in search results?
Absolutely. Fiverr’s search algorithm considers your CTR, conversion rate, and response time when ranking gigs. By using your analytics to improve these metrics, you’re indirectly boosting your search ranking. Higher conversion rates signal to Fiverr that buyers find your gig valuable, which leads to more impressions — creating a virtuous cycle of growth.
Why are my Fiverr impressions suddenly dropping?
Sudden impression drops can happen for several reasons: increased competition in your category, seasonal demand changes, algorithm updates, a drop in your seller performance metrics (like response time or cancellation rate), or your gig being temporarily suppressed due to a policy issue. Check your seller dashboard for any warnings, review your performance scores, and consider refreshing your gig tags and title with current search terms.
Does Fiverr analytics show data about my competitors?
No, Fiverr analytics only shows data about your own gigs and performance. However, you can manually research competitors by searching for your target keywords and studying the top-ranking gigs. Look at their thumbnails, pricing, review counts, and descriptions to identify opportunities where you can differentiate and improve your own offerings.


Leave a Reply